Prices of second-hand homes in Italy fell 0.6% in January, with an average of 1,810 euro/m2 or 168 euro/sq ft. According to idealista’s market details, the trends are still pretty negative. If we consider the data for January 2017 (1,895 euro/m2 or 176 euro/sq ft), the interannual decrease has been 4.4 percentage points.
Regions
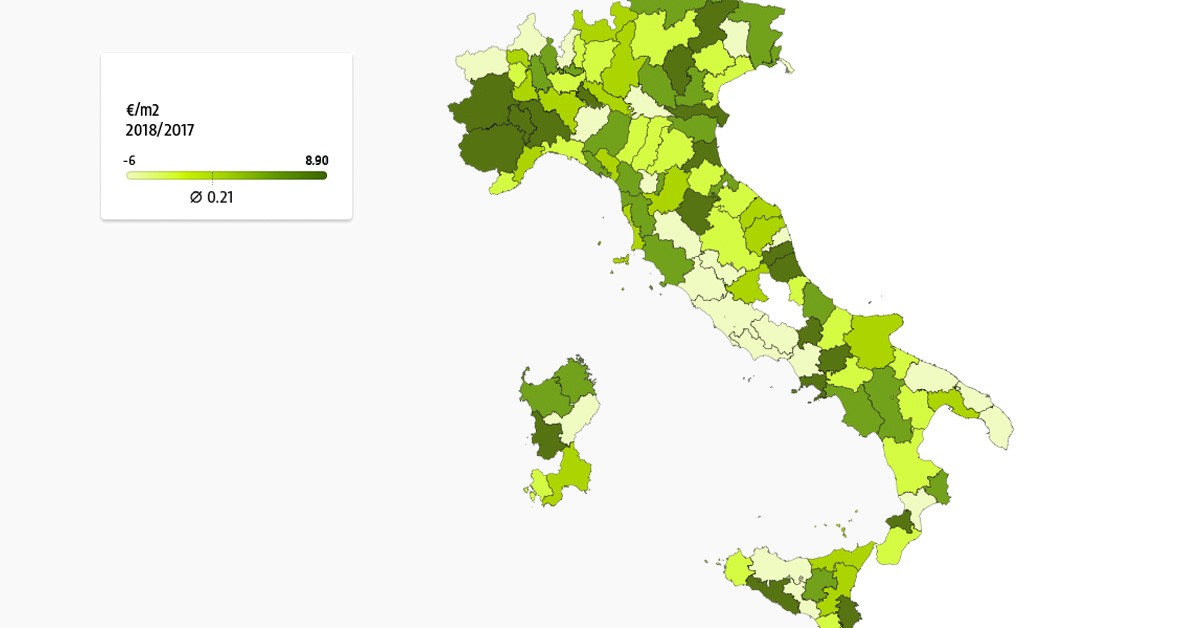
There are 8 regions with a positive balance in January, with the biggest price increases being in Piedmont (2.0%), followed by Emilia-Romagna (0.7%) and Sardinia (0.6%). Prices have remained stable in Liguria, while in every other region they have fallen. The biggest drops have been in Lazio (-3.0%), Umbria (-2.4%) and Puglia (-1.6%).
In terms of nominal values, Liguria has consolidated itself as the most expensive in which to buy a house, at an average of 2,614 euro per square metre/243 euro per square foot, followed by the Aosta Valley (2,483 euro/m2 or 231 euro/sq ft) and Lazio (2,377 euro/m2 or 221 euro/sq ft). On the lower end, we have Calabria with an average of 897 euro per square metre/83 euro per square foot, Molise (1,012 euro/m2 or 94 euro/sq ft) and Sicily (1,138 euro/m2 or 106 euro/sq ft).
Provinces
Negative variations were registered in 55 provinces out of a total of 107. The largest drops in January were in Terni (-6.0%) and Fermo (-4.8%), followed by Frosinone and Viterbo, the two regions with decreases of 3.8%. In contrast, the largest price hikes were in Alessandria (8.6%), Lodi (6.8%) and Benevento (5.8%).
The price ranking of properties in different provinces is as follows: Savona (3,369 euro/m2 or 313 euro/sq ft), Bolzano (3,149 euro/m2 or 293 euro/sq ft) and Imperia (2,691 euro/m2 or 250 euro/sq ft). At the lower end of the ranking, there are 17 areas with prices of no more than a thousand euro per square metre, 93 euro per square foot, such as Ragusa (991 euro/m2 or 92 euro/sq ft) and Biella (694 euro/m2 or 64 euro/sq ft).
Autonomous capitals and cities
Despite the generalised price decreases in the country, more than half of the capitals, 62 out of 104, have inverted this tendency. Alessandria (7.2%), Fermo (5.9%) and Cuneo (5.0%) show the biggest increases. Many of the main cities have had positive results, with the following increases: Turin (4.3%), Naples (3.1%), Milan (1.5%), Bologna (1.1%) and Florence (0.6%). On the other hand, Rome and Venice have remained negative, with a price drop of 0.7% each. Meanwhile, Frosinone (-5.0%), Viterbo (-4.7%) and Belluno (-4.0%) fell sharply.
In the price rankings, Venice (4,347 euro/m2 or 404 euro/sq ft) is the most expensive city, followed by Florence (3,459 euro/m2 or 321 euro/sq ft) and Bolzano (3,423 euro/m2 or 318 euro/sq ft). The last city in the idealista rankings is Biella, at 725 euro per square metre/67 euro per square foot, followed by Caltanissetta (747 euro/m2 or 69 euro/sq ft) and Alessandria (847 euro/m2 or 79 euro/sq ft).
idealista’s property price index
The real estate website ‘idealista’ is currently one of the most used in Italy by both individuals and real estate professionals to buy, sell and rent properties. With a database of more than a million properties, idealista’s studio office has been analysing property prices in the country since 2007.
This analysis consisted of a comparison of 409,264 real estate listings published on idealista in January 2018 that passed a quality control based on such information as price, size, distribution and not being duplicated.
To allow for a satisfactory standardisation of the results, only those municipalities which kept a constant average of 50 or more second-hand properties for sale published during the research period were analysed. The municipalities which didn’t reach this average were excluded from the sample group, as were those which registered a variation of more than 30% in the number of listings during the period in question.